

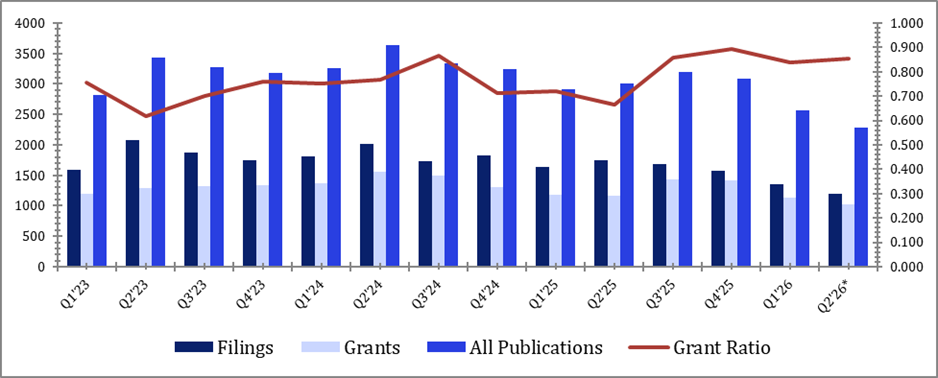
Defence budgets are growing globally; the patent data beneath them receives far less attention. Electronic warfare patent publications totalled 11,125 in the 12 months to June 2026, against 12,490 in the prior year: a 10.9% contraction in volume. Grant ratio (grants published against applications published in the same window, a flow measure that rises above 1.0 when prior-period backlogs convert) rose from 0.741 to 0.863, the highest reading in the 14-quarter dataset.
The sector is not retreating but concentrating. Rising geopolitical tensions have accelerated defence procurement budgets and patent data, according to GlobalData Patent Analytics, identifies which operators are converting that tailwind into a durable competitive advantage. GlobalData analysis also finds that patent-identified leaders have outperformed the sector’s own budget-driven tailwind, a finding explored in the report, Extracting Innovation Alpha Using Patents.
Volume has normalised
Electronic warfare patent activity peaked at 3,643 publications in Q2 2024. The TTM quarterly run rate of 2,781 is 23.6% below that peak. Grant ratio rose from 0.741 in the prior year to 0.863 in the TTM: a dataset high and a 12.2 percentage point improvement. Rising grant ratio alongside falling volume signals a sector filing more substantively: weaker applications are falling away, and the positions advancing to grant carry stronger examiner-acceptance quality. Q4 2025 recorded the highest single-quarter grant ratio at 0.895, reflecting that conversion from a prior-period filing backlog has been ongoing.
Thales SA (EPA: HO), the most active listed prime in the open patent database with 229 TTM publications, is concentrated in G01S13/00 radar systems, where 188 publications establish it as the dominant commercial-operator position in that technology area. A sector filing more selectively with a rising grant ratio is not contracting; it is building barriers that late entrants will find progressively harder to cross.
Figure 1: Electronic Warfare Patent Publications by Quarter — Q1 2023 to Q2 2026
Source: GlobalData Patent Analytics
C4ISR integration and weaponry are growing
Intelligence, Surveillance and Reconnaissance (ISR) accounts for the largest share of TTM sector publications, with H2 publications of 2,424, down 21.6% from 3,092 in H1. Electronic Warfare core filings declined 34.3% in H2 to 717 publications; Land ISR fell 20.7% to 717 publications; Aerospace contracted 29.4%. Against this backdrop of broad contraction, the sub-sector data contains a more precise signal.
C4ISR and Electronic Warfare integrated systems grew 3.5% to 146 publications in H2; Weaponry grew 11.6% to 125. These sub-sectors capture the integration of electronic warfare with conventional kinetic systems: a directional signal consistent with the operational doctrine shifts reflected in recent procurement awards. Commercial operators actively filing in both growing sub-sectors include Thales SA (EPA: HO), BAE Systems Plc (LSE: BA.), and RTX Corp (NYSE: RTX), whose combined sector exposure in C4ISR and Weaponry leads the listed-prime universe in the TTM.
Figure 2: Electronic Warfare Patent Publications by Sub-Sector — H1 vs H2, Jul 2025 to Jun 2026
Source: GlobalData Patent Analytics
Thales is accelerating. No other named prime is
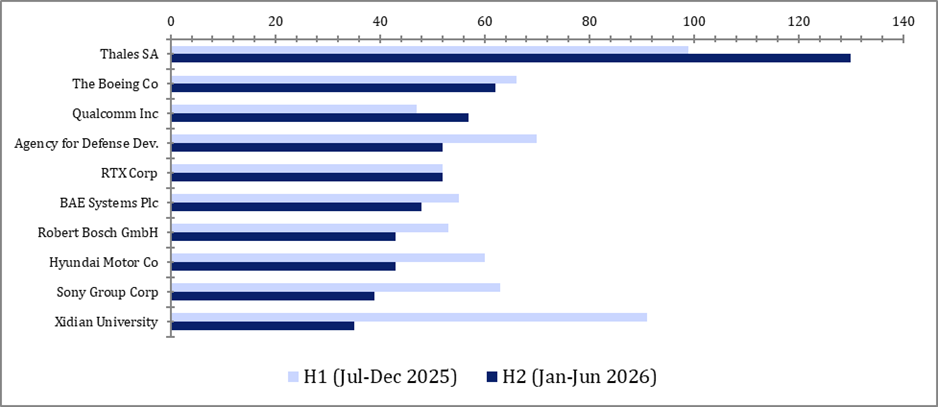
Thales SA (EPA: HO) leads the named listed primes with 229 TTM publications and a 31.3% H2 growth rate, rising from 99 in H1 to 130 in H2. Among the broader top ten filers, Qualcomm Inc (NASDAQ: QCOM) added 57 publications in H2 against 47 in H1: a 21.3% increase, building exposure in autonomous systems and image analysis classifications. The two accelerating operators are diverging from the field on different vectors: Thales on volume and radar-systems depth, Qualcomm on AI-adjacent classifications.
RTX Corp (NYSE: RTX) was flat at 52 publications in both H1 and H2, with TTM exposure concentrated in Directed Energy Weapons (18 publications) and Aerospace (16). BAE Systems Plc (LSE: BA.) contracted 12.7%, from 55 to 48 in H2; its Electronic Warfare sector exposure of 28 publications remains its largest single-sector position in the TTM, though the direction of travel is downward. Rheinmetall AG (ETR: RHM) declined 60.0% in H2, from 15 to six publications. Lockheed Martin Corp (NYSE: LMT) records eight TTM publications in the open patent database, consistent with a company whose electronic warfare IP is primarily filed through classified channels or subsidiary structures not captured in open records. Xidian University, the dataset’s leading academic filer at 126 TTM publications, contracted 61.5% in H2. Academic filing responds to funding cycles; commercial filing responds to product roadmaps. Thales is the exception that makes the pattern legible.
Figure 3: Electronic Warfare Patent Publications by Assignee — H1 vs H2, Jul 2025 to Jun 2026
Source: GlobalData Patent Analytics
Four Jurisdictions Converting Above 1.0. The Largest Market at 0.72.
China leads by volume at 4,903 publications: 44.1% of the TTM total, at a grant ratio of 0.722. The US, with 2,060 publications, converts at 1.178: nearly 12 granted patents per ten applications filed in the period. The European Patent Office converts at 1.330; South Korea at 1.099; Japan at 1.116. Four of the five largest non-WIPO jurisdictions are converting above 1.0, reflecting a substantial backlog of prior-period applications advancing to grant.
Israel stands apart: 108 publications and a ratio of 5.750, with 92 grants recorded against 16 new applications in the period. That reading reflects a prior-period backlog converting to grant rather than a contemporaneous quality signal and should be read as a timing artefact. WIPO carries 395 publications pending national-phase designation with no grant figure, as jurisdiction selection has not yet completed. Volume and quality rankings diverge; China leads on the former, and among the substantive jurisdictions the US and the European Patent Office lead on the latter.
Figure 4: Electronic Warfare Patent Publications by Authority — TTM Jul 2025 to Jun 2026
■ GR >= 1.00 ■ GR 0.50–0.99 ■ GR < 0.50 ■ No activity / Pending
Source: GlobalData Patent Analytics
The evidence that this leads to outperformance.
Thales SA (EPA: HO) and the US, European, and Asian patent jurisdictions are building high-quality IP positions in the TTM window. That signal is not visible in product announcements or procurement award disclosures at the time the patent data is published. Companies building patent positions at rising quality while the sector contracts generate 1.4x higher revenue growth than sector peers in the subsequent three to five years, according to GlobalData’s report Extracting Innovation Alpha Using Patents. That is not a quant construct; it is a fundamental signal that patent data surfaces before earnings commentary does.
The full evidence for how patent indicators convert into systematic outperformance is set out in GlobalData’s Extracting Innovation Alpha Using Patents: 5% to 7% annualised alpha over the S&P 500 and 6% to 9% against innovation benchmarks (MSCI World Technology, Nasdaq Composite) across seven years, portfolios outperforming 85% of the time, and 1.4x higher revenue growth in the companies the framework identifies as innovation leaders. The Electronic Warfare data in this article is one expression of the same underlying dynamic.
Download the free report below or request a data sample by contacting hirendra.vikram@globaldata.com to start translating complex patent activity today.

